High Availbility

OS & Virtualization

Showing posts with label SQLserver. Show all posts

Monday, August 19, 2019

SQLServer Performance Troubleshooting

Performance tuning


  • Dynamic Management Views (DMVs) and System Catalog Views
  • Profiler and Server Side Traces
  • Windows Performance Monitor
  • Built in performance reports in SSMS
  • Query Plans
  • Database Tuning Advisor
DMV Views
The sys.dm_exec_query_stats DMV is a server-scoped DMV that returns aggregate
performance statistics for cached query plans.

The following code block returns information about the top five queries run against
the master database by the maximum number of physical reads:

USE master;
GO
SELECT TOP 5 sql_handle, last_execution_time, max_physical_reads
AS [max_physical_reads]
FROM sys.dm_exec_query_stats
ORDER BY creation_time DESC;
GO

The sys.dm_os_wait_stats DMV returns information about waits encountered by
threads that are in execution

The sys.dm_tran_locks DMV returns information about currently active lock manager
resources.

Failure Diagnosing


Log File Viewer
The Log File Viewer allows you to view log files from a variety of sources

Using query
SELECT message_id, language_id, severity, is_event_logged, text
FROM sys.messages
WHERE language_id = 1033;

Transaction Log Is Full
SQL Server database engine issues a 9002 error
Options for responding to a full transaction log include the following tasks:
■ Backing up the log
■ Increasing disk space or moving the log to another volume
■ Increasing log file size
■ Terminating long-running transactions

Specific Database Is Out of Space
ALTER DATABASE command to add a file group on
a separate volume to the database

Recycling the SQL Server Log
Start a new SQL Server log by using the sp_cycle_errorlog stored
procedure.


Tuesday, October 01, 2013

SQLServer commands 2

Querying dynamic management views:
  • You can query sys.dm_exec_requests to find blocking queries.
  • You can query sys.dm_os_memory_cache_counters to check the health of the system memory cache.
  • You can query sys.dm_exec_sessions for information about active sessions.
  • You can use sys.dm_db_index_physical_stats  to check index fragmentation
Running basic DBCC commands:
  • You can use DBCC FREEPROCCACHE to remove all elements from the procedure cache.
  • You can use DBCC FREESYSTEMCACHE to remove all unused entries from all caches.
  • You can use DBCC DROPCLEANBUFFERS to remove all clean buffers from the buffer pool.
  • You can use DBCC SQLPERF to retrieve statistics about how the transaction log spaceis used in all databases.
  • DBCC SHOWCONTIG to show index fragmentation
Using the KILL command to end an errant session


Identifying and Rectifying the Cause of a Block
SELECT session_id, status, blocking_session_id
 FROM sys.dm_exec_requests
 WHERE blocking_session_id >
 
Finding Last Backup Time for All Database
SELECT sdb.Name AS DatabaseName,
COALESCE(CONVERT(VARCHAR(12), MAX(bus.backup_finish_date), 101),'-') AS LastBackUpTime
FROM sys.sysdatabases sdb
LEFT OUTER JOIN msdb.dbo.backupset bus ON bus.database_name = sdb.name
GROUP BY sdb.Name
 
Duration of backup
DECLARE @dbname sysname
SET @dbname = NULL --set this to be whatever dbname you want
SELECT bup.user_name AS [User],
 bup.database_name AS [Database],
 bup.server_name AS [Server],
 bup.backup_start_date AS [Backup Started],
 bup.backup_finish_date AS [Backup Finished]
 ,CAST((CAST(DATEDIFF(s, bup.backup_start_date, bup.backup_finish_date) AS int))/3600 AS varchar) + ' hours, '
 + CAST((CAST(DATEDIFF(s, bup.backup_start_date, bup.backup_finish_date) AS int))/60 AS varchar)+ ' minutes, '
 + CAST((CAST(DATEDIFF(s, bup.backup_start_date, bup.backup_finish_date) AS int))%60 AS varchar)+ ' seconds'
 AS [Total Time]
FROM msdb.dbo.backupset bup
WHERE bup.backup_set_id IN
  (SELECT MAX(backup_set_id) FROM msdb.dbo.backupset
  WHERE database_name = ISNULL(@dbname, database_name) --if no dbname, then return all
  AND type = 'D' --only interested in the time of last full backup
  GROUP BY database_name)
/* COMMENT THE NEXT LINE IF YOU WANT ALL BACKUP HISTORY */
AND bup.database_name IN (SELECT name FROM master.dbo.sysdatabases)
ORDER BY bup.database_name


Thursday, March 28, 2013

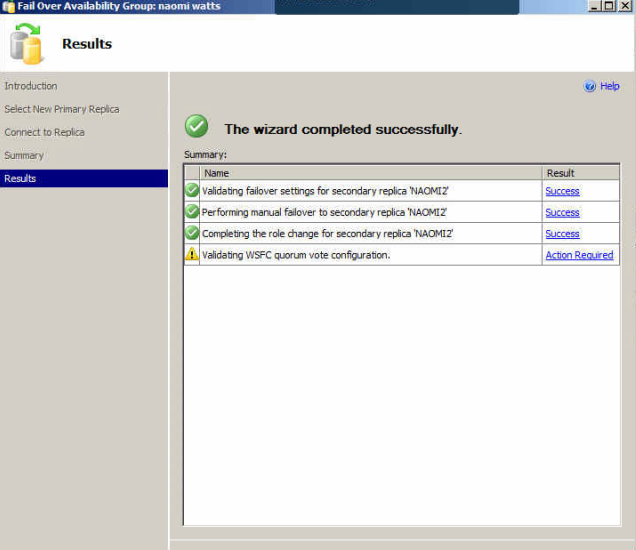
How to Set Up SQL Server 2012 AlwaysOn Availability Groups

Advantages
  • fail over automatically
  • ability to run reports on the live database
  • Run backup on standby server
Prerequisites
  • 2 Windows Server 2008 R2 Enterprise servers
  • NET Framework 3.5.1 feature
  • Failover Clustering feature

Steps
  • Configure Failover Cluster Manager.
  • Join 2 servers to the the same domain
  • Create Cluster Wizard
  • Install SQL Server stand-alone installation
  • In Configuration Manager, enable AlwaysOn by clicking SQL Server Services


Thursday, March 01, 2012

SQLServer commands

CommandPurposeSample Usage
sp_helpdbThis gives you information about all databases in the instance or specific information about one database.
  • sp_helpdb
  • sp_helpdb databasename
fn_virtualfilestatsThis command will show you the number of read and writes to a data file. Use sp_helpdb with the database name to see the logical file numbers for the data files and the database id.
  • SELECT * FROM :: fn_virtualfilestats(dabaseid, logicalfileid)
  • SELECT * FROM :: fn_virtualfilestats(1, 1)
fn_get_sql()Returns the text of the SQL statement for the specified SQL handle. This is similar to using DBCC INPUTBUFFER, but this command will show you additional information. This can also be embedded in a process easier then using the DBCC commandMSSQLTips additional info
  • DECLARE @Handle binary(20)
    SELECT @Handle = sql_handle FROM sysprocesses WHERE spid = 52 SELECT * FROM ::fn_get_sql(@Handle)
sp_lockThis command shows you all of the locks that the system is currently tracking This is similar to information you can see in Enterprise Manager.
  • sp_lock
  • sp_lock spid
  • sp_lock spid1, spid2
sp_helpThis command gives you information about the objects within a database. The command without an objectname will give you a list of all objects within the database.
  • sp_help
  • sp_help objectname
sp_who2Gives you process information similar to what you see when using Enterprise Manager.
  • sp_who2
  • sp_who2 spid
sp_helpindexGives you information about the indexes on a table as well as the columns used for the index.MSSQLTips additional info
  • sp_helpindex objectname
sp_spaceusedThis command shows you how much space has been allocated for the database (or if specified an object) and how much space is being used.
  • sp_spaceused
  • sp_spaceused objectname
DBCC CACHESTATSDisplays information about the objects currently in the buffer cache.
  • DBCC CACHESTATS
DBCC CHECKDBThis will check the allocation of all pages in the database as well as check for any integrity issues.
  • DBCC CHECKDB
DBCC CHECKTABLEThis will check the allocation of all pages for a specific table or index as well as check for any integrity issues.
  • DBCC CHECKTABLE (‘tableName’)
DBCC DBREINDEXThis command will reindex your table. If the indexname is left out then all indexes are rebuilt. If the fillfactor is set to 0 then this will use the original fillfactor when the table was created.MSSQLTips additional info
  • DBCC DBREINDEX (tablename, indexname, fillfactor)
  • DBCC DBREINDEX (authors, '', 70)
  • DBCC DBREINDEX ('pubs.dbo.authors', UPKCL_auidind, 80)
DBCC PROCCACHEThis command will show you information about the procedure cache and how much is being used. Spotlight will also show you this same information.
  • DBCC PROCCACHE
DBCC MEMORYSTATUSDisplays how the SQL Server buffer cache is divided up, including buffer activity.
  • DBCC MEMORYSTATUS
DBCC SHOWCONTIGThis command gives you information about how much space is used for a table and indexes. Information provided includes number of pages used as well as how fragmented the data is in the database.
  • DBCC SHOWCONTIG
  • DBCC SHOWCONTIG WITH ALL_INDEXES
  • DBCC SHOWCONTIG tablename
DBCC SHOW_STATISTICSThis will show how statistics are laid out for an index. You can see how distributed the data is and whether the index is really a good candidate or not.
  • DBCC SHOW_STATISTICS (tablename, indexname)
DBCC SHRINKFILEThis will allow you to shrink one of the database files. This is equivalent to doing a database shrink, but you can specify what file and the size to shrink it to. Use the sp_helpdb command along with the database name to see the actual file names used.MSSQLTips additional info
  • DBCC SHRINKFILE (filename, size in MB)
  • DBCC SHRINKFILE (DataFile, 1000)
DBCC SQLPERFThis command will show you much of the transaction logs are being used.
  • DBCC SQLPERF(LOGSPACE)
DBCC TRACEONThis command will turn on a trace flag to capture events in the error log. Trace Flag 1204 captures Deadlock information.
  • DBCC TRACEON(traceflag)
DBCC TRACEOFFThis command turns off a trace flag.